

Introduction: Average Mortgage Rates Today as Well as Historical Mortgage Rates
Taking out a mortgage is usually the largest expense that most families ever make. Dedicating 15 or 30 years of one’s life to paying off a home loan is a goal that most adults have.
The housing mortgage crisis of 2008, however, showed that many banks were too eager to give out loans to people who didn’t understand how the average mortgage interest rate would affect their long-term financial stability.
Comprehending how mortgage loan rates and the specific terms of a mortgage will affect your livelihood is a basic aspect of financial literacy.
The average mortgage rates vary widely from place to place and depend on a variety of factors. Smart buyers always check the mortgage rate history to search for trends that could allow them to obtain a more favorable mortgage rate. Besides going to the bank to ask for its specific average mortgage interest rate, what is the best way to find the best average mortgage rates for you and your family?
In this brief article, AdvisoryHQ will help clear up some of the confusion regarding mortgage loan rates.
We will let you know why it is important to research daily mortgage rates before finalizing your home loan and will show you how even an amateur buyer can analyze a simple mortgage rate trend chart to learn how the mortgage rate history may affect the mortgage rate on a home.
The article will then go on to look at a few mortgage rate charts and mortgage rate graphs that show the trends in mortgage loan rates. We will guide you to a few helpful websites with quality and up-to-date mortgage interest rate charts that you can reference as you search for the best deal to help you purchase your new home.
See Also: Best Banks for Mortgages – A Complete Guide (Best Mortgage Rates & Reviews)
The Importance of Checking Daily Mortgage Rates Before Buying a House
In 1981, mortgages rates rose by almost 18%. The average cost of a house in that period was just around $80,000. That meant that during the span of a 30-year mortgage, you would have ended up paying an interest amounting to about 82% of the entire cost of the home. For comparison, if the average mortgage interest rate would have stayed at 18%, a $300,000 house in today’s market would end up costing around 1.25 million dollars over a 30-year mortgage.
Fortunately, the average mortgage rates have decreased dramatically since then, with most buyers able to get an average mortgage interest rate somewhere between 3 and 5%. Nonetheless, those punishing historical mortgage rates may one day come back as the economy shifts and changes.
To put it simply, no one should consider buying a home that comes with interest rates similar to those in the early 1980s. If you were unfortunate enough to sign a mortgage during a time when mortgage rates were sky high, you should seriously consider refinancing your mortgage.
Refinancing your mortgage does come with its own set of difficulties and can cause your credit rating to take a hit. To avoid those issues, it is best to study different mortgage interest rate charts before signing your name to a home loan.
Even though the daily mortgage rates in today’s market are significantly lower than in past years, there is still a huge difference between finding a 3% and 5% annual percentage rate loan.
Let’s say that you and your family want to purchase a $250,000 home. One bank offers you the most competitive average mortgage rate of 3% while another bank charges you 5%.
After a 20% down payment on your mortgage, you would end up paying $180,000 in interest over 30 years if you were qualified for the 3% average mortgage rate.
However, if you were unlucky enough to sign for a 5% average mortgage rate, you would end up paying $300,000 in interest over those same 30 years.
That $120,000 can make a huge difference in nearly anyone’s financial situation. While interest rates usually don’t fluctuate that much between banks, a research of the mortgage rate history shows that the average mortgage rate can fluctuate wildly from year to year.
Though no one can tell the future exactly, there are trends that can be seen through researching and studying historical mortgage rates. If you think that there is a possibility that the average mortgage rates will come down even half a percentage point in the coming months or year, it might be best for you to continue to sleep in your parents’ basement or keep throwing money into rent.
By buying time for a better mortgage rate to appear, you could save yourself thousands of dollars in the long run.
Don’t Miss: Caliber Home Loans Reviews – What You Need to Know Before Using Caliber
All-in-One Change Management Tools


Top Rated Toolkit for Change Managers.
Get Your Change Management Tool Today...
How History Can Tell Us the Direction That Mortgages Rates Are Headed
As we mentioned above, predicting the direction that mortgage rates are headed isn’t an exact science. There is no crystal ball that tells our financial future. Nonetheless, there are a number of simple resources on the Internet that even the most financially illiterate person can understand.
For example, look at how the mortgage rate history is quite easily understood in the following mortgage interest rate chart offered by bankrate.com.

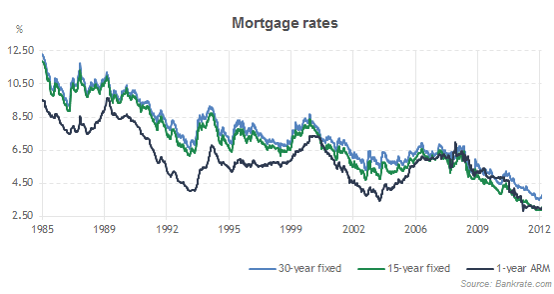
Image Source: Mortgage Interest Rates History
Pretty much anyone can see that there has been an obvious trend of decreasing average mortgage rates during the past 30 years. This mortgage rate trend chart should tell potential home buyers a number of things. Firstly, if a bank is offering you a rate over 5%, then that is bank is clearly stuck in the past.
Secondly, this mortgage rate chart clearly shows that the historical mortgage rates tend to momentarily spike every 5–7 years. From 1988 to 1989, mortgage rates continued to rise before falling steadily up until around 1994 and 1995. The same trend occurred between 1995 and 2001 and then again between 2001 and 2005.
As this mortgage interest rate chart shows, the average mortgage rates have been falling steadily since the end of the mortgage crisis in 2008, for close to 8 years now. If the mortgage rate history trend during the past 30 years continues, then we are past due for another temporary spike in mortgage rates.
The average mortgage rates will never approach zero, so it is to be expected that sometime in the near future rates will again go up. While the daily mortgage rates may continue to go down for the considerable future, if you are considering buying a home, now might be the best time to find the best average mortgage rates.


A Few Current Mortgage Rate Charts and Mortgage Rate Graphs
Most people are not willing to wait for a year or so for the average mortgage rates to come down. Sometimes, a new family member arrives or work suddenly takes you to a new city, and buying your home becomes an urgent necessity.
But even if you are looking to purchase a home in the immediate future, understanding how daily mortgage rates fluctuate can help you find and sign a beneficial average mortgage interest rate.
Below, we look at a few mortgage rate charts and mortgage rate graphs that will help you in your search for the best daily mortgage rate.
- Bankrate Mortgage Rate Graph and Mortgage Rate Chart
This mortgage rate graph offered by bankrate.com easily shows how the current average mortgage interest rate changes from month to month. As you can see in the graph, the average mortgage rates were almost 0.2% higher in June than in August.
While that may not seem like much to the average home buyer, it is important to remember that over the course of 30 years, the small difference can add up quickly.
This web page is also helpful because you can check the current interest rates for CDs, auto loans, home equity loans, and credit cards all on the same page.

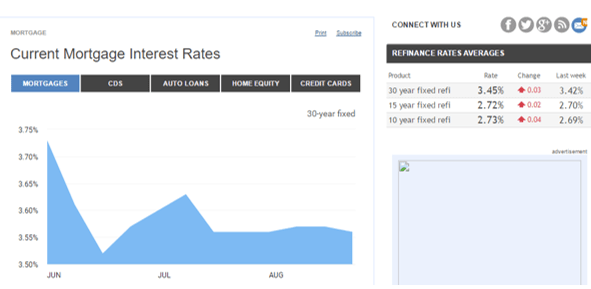
Image Source: Current Mortgage Interest Rates
On the same website, you can also review a quality mortgage rate chart that offers detailed weekly information on the interest rates for different types of mortgages.
You can check how the average mortgage interest rate varies from week to week for the following types of mortgages: 30-year fixed mortgage, 15-year fixed mortgage, 5/1 ARM, and 30-year jumbo mortgage.

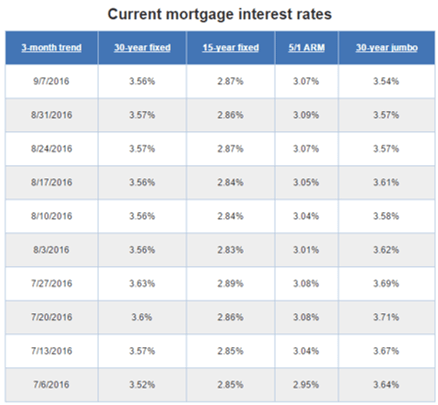
Image Source: Current Mortgage Interest Rates


- Zillow.com Mortgage Rate Graph
Zillow.com is one of the most well-known and respected online real estate companies. Besides helping to connect home sellers and home buyers, it also offers quality information regarding the average mortgage interest rates.
On its website, you can easily search for the average mortgage rates in your region. As the sample mortgage rate graph below shows, you can choose from a number of mortgage conditions, including 30-year fixed, 20-year fixed, 15-year fixed, 10-year fixed, and other less common mortgage terms such as 5/1 APM.

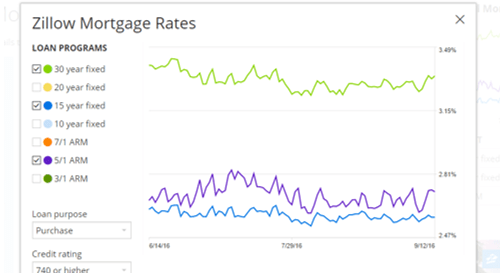
Image Source: Zillow Mortgage Rates
Related: Carrington Mortgage Reviews – All You Need to Know (Mortgage Services Reviews)
Furthermore, willow.com allows potential home buyers to enter the conditions of their proposed home loan in order to receive personalized quotes from some of the most well-respected banks on the market. You can choose to find the average mortgage rates for both the purchase and refinancing of your home.
Since mortgage rates do change depending on location, credit score, and other aspects, the detailed search provided by Willow asks you to input your zip code, last known credit score, and other detailed information.
While you will have to contact a bank to get the specifics of your mortgage conditions, this website provides a good start in your search for the average mortgage interest rate in your area.
- Mortgage Rate Graph by Mortgage News Daily

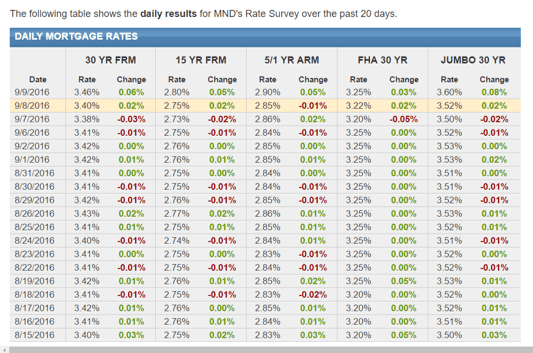
Image Source: Detailed Mortgage Rate Graph
Mortgage News Daily provides perhaps the most detailed mortgage rate graph detailing the daily mortgage rates. This graph is updated daily and shows the national average mortgage rates during the past 20 days for a wide variety of different mortgage terms. Furthermore, the graphs clearly outline the percentage change on a daily basis so that you can search for patterns in this mortgage rate trend chart.
Popular Article: Churchill Mortgage Reviews – What You Want to Know (Complaints & Review)
Free Wealth & Finance Software - Get Yours Now ►
How Studying Mortgage Rate History Can Help You Find the Best Mortgage Rates
Taking the time to search for the best average mortgage interest rates is an important step that everyone should take before purchasing a home. As we have shown, studying mortgage rate history and searching for trends is possible even for first-time buyers with little to no experience in tracking mortgage rates.
If after researching historical mortgage rates you still don’t feel comfortable in predicting the trends for the future, there are a number of websites dedicated to forecasting mortgage rates for up to a year in the future.
Longforecast.com is one such website where you can compare your own ideas and hunches regarding the future average mortgage rates with the predictions of experts.
Another website, themortgagereports.com, considers that “mortgage rates are terribly unpredictable. Consumers find themselves checking rates daily, even hourly. They want to catch the lowest rates, but don’t want to chase them on the way up. If that sounds like you, you’re not alone. Any prospective mortgage applicants would want a Magic 8 Ball that would show them rates for next week, next month, and next year. Unfortunately, no such predictor exists. Still, it can be constructive to examine how rates have fared so far this year, and look at what might influence rates in the second half of 2016.”
By taking the necessary time to search for the best average mortgage interest rates, you can make sure that your home buying experience will be one that you don’t ultimately regret. Despite the uncertainty regarding mortgages, finding the best average mortgage rate is possible with a little bit of time and dedication.
Read More: Cost to Build a Home – What You Might Be Missing! (Typical Closing Costs, Estimated & Average)
AdvisoryHQ (AHQ) Disclaimer:
Reasonable efforts have been made by AdvisoryHQ to present accurate information, however all info is presented without warranty. Review AdvisoryHQ’s Terms for details. Also review each firm’s site for the most updated data, rates and info.
Note: Firms and products, including the one(s) reviewed above, may be AdvisoryHQ's affiliates. Click to view AdvisoryHQ's advertiser disclosures.